

Key Takeaways
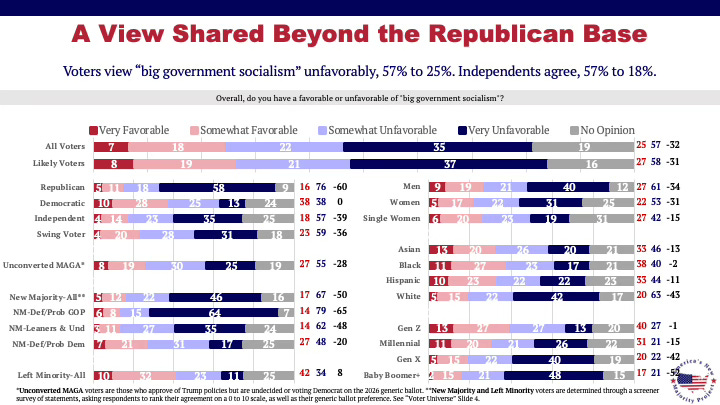
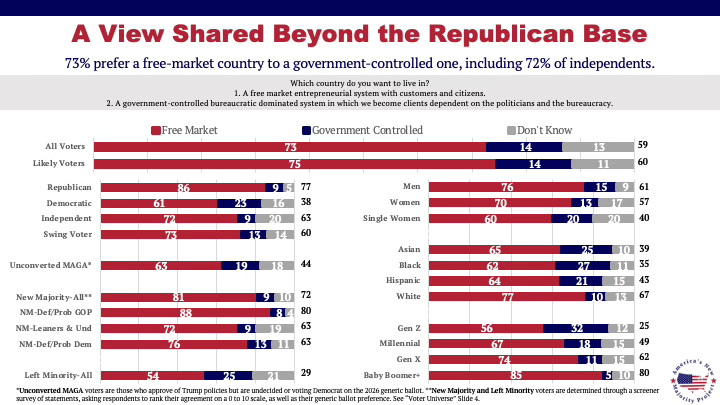
Voters reject big government socialism by more than 2 to 1. 57% view it unfavorably. Only 25% view it favorably. And 73% would rather live in a free-market country than a government-run one (14%).
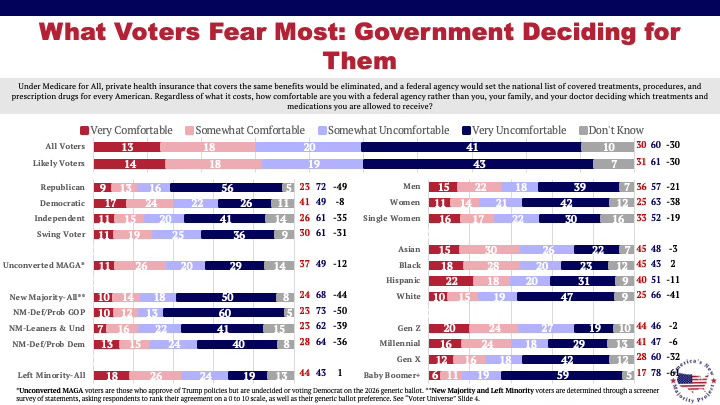
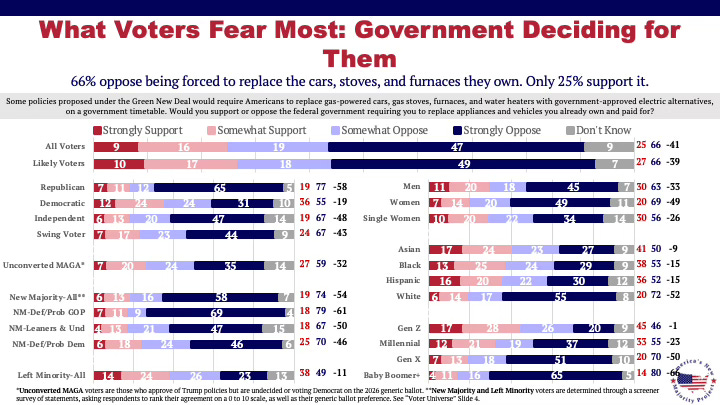
The biggest fear is losing control over your own life. 6 in 10 voters are uncomfortable with a federal agency deciding what medical care they can get. 2 in 3 oppose being forced to replace the cars and appliances they already own.
Findings build upon earlier research. ANMP has established that “big government socialism” is perceived more negatively than “socialism” alone, making it the preferred terminology to describe the left. These results explain more about why that is.
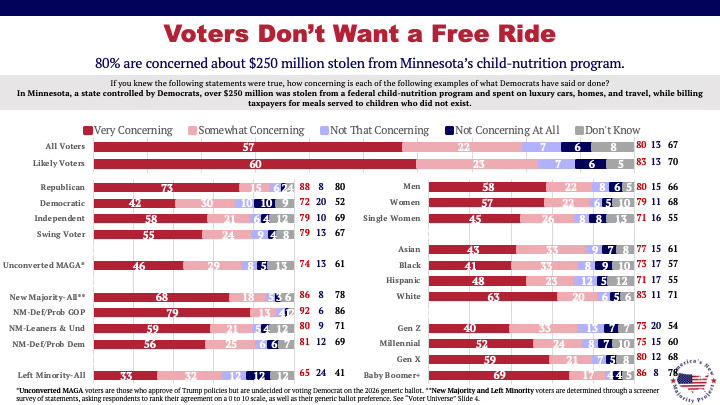
Voters do not want a free ride. 3 in 4 voters say able-bodied adults should have to work, look for work, or go to school to get welfare. And 8 in 10 are concerned about the $250 million Minnesota child-nutrition fraud.
Why It Matters
Socialism is usually sold with promises: free healthcare, and someone else pays. But voters will also judge it by what it takes away: their choices, their property, and their tax dollars. When the question becomes “Who decides?”, voters side with themselves, not Washington. That view is shared by independents, undecided voters, and even many Harris voters.
How To Use This Data
Lead with control, and keep it personal: your doctor, your car, your home, your savings. Avoid leading with cost alone: Medicare for All stays close to even when voters only hear the price tag.
What Voters Fear Most: Government Deciding for Them
Your healthcare: 60% are uncomfortable with a federal agency, rather than you and your doctor, deciding which treatments and medicines you can get. Only 30% are comfortable.
Your car and appliances: 66% oppose a federal rule forcing Americans to replace gas cars, stoves, and furnaces they already own. Only 25% support it.
Your property and savings: 58% call government control of private property “big government socialism.” 60% say the same about taxing your home, investments, and retirement savings.
Your country: 73% want a free-market country. Only 14% want a government-run system where people depend on politicians.
The takeaway is clear: voters want to make their own choices. When government tries to make those choices for them, opposition wins by wide margins.
Voters Don’t Want a Free Ride
Socialist candidates often promise more benefits paid for by someone else. Voters are not buying it.
Work for welfare: 75% agree able-bodied adults should have to work, look for work, or go to school to receive welfare. Only 15% disagree, and 59% agree strongly.
Even Democrats agree: 65% of Democrats, 66% of Harris voters, and 73% of independents support work requirements.
Fraud is a dealbreaker: 80% are concerned that over $250 million was stolen from a child-nutrition program in Democrat-run Minnesota, with 57% very concerned. 54% say allowing widespread welfare fraud is “big government socialism.”
“The billionaires will pay” is not believed: Only 28% think taxing billionaires alone could pay for Medicare for All. 61% say taxes would have to rise on far more people, including 28% who say most taxpayers, middle class included.
The message is simple: help should come with responsibility, and taxpayer money must be protected. Those two ideas unite voters across party lines.
A View Shared Beyond the Republican Base
These concerns are not limited to Republicans.
Independents: 57% view big government socialism unfavorably (18% favorably). 61% are uncomfortable with a federal agency deciding their care, and 72% prefer a free-market country (9% prefer a government-run one).
Undecided voters: 55% unfavorable versus just 11% favorable, a 5-to-1 margin. They prefer a free-market country by 64% to 8%.
Harris voters: 51% are uncomfortable with a federal agency deciding their care, 57% oppose the car and appliance mandate, and 66% support work requirements for welfare.
Age: Opposition grows with age, from 39% unfavorable among voters 18–24 to 69% among voters over 65. Younger voters are less settled, but those under 44 still prefer a free-market country by 63% to 24%.
When independents, undecided voters, and many Harris voters agree, this is not just a partisan talking point. It is a broad defense of personal choice.
The Bottom Line
Voters are not just rejecting a label. They are rejecting a government that decides for them and programs that hand out money without responsibility or protection from fraud. The strongest case against big government socialism is simple: you should decide, not Washington.
Download the ANMP memo brief on this survey.
Mclaughlin & Associates partnered with Gingrich360 to conduct a national survey for America’s New Majority Project. This national survey was conducted among 2,000 registered voters between August 29 to September 2, 2026.
All interviews were conducted online. Survey invitations were distributed randomly within predetermined geographic units. These units were structured to correlate with actual general election turnout.
The sample of 2,000 registered voters has an accuracy of +/- 2.2% at a 95% confidence interval. The numbers in this presentation have been rounded and may not equal 100%..
What’s Next
We have exciting updates on how American voters feel about the many policies Americans are looking at that will decide how they vote in the upcoming 2026 midterm elections.
We’d love to hear your thoughts! Please share which topics you’d like to hear about regarding where American voters stand on various issues.