


Key Takeaways
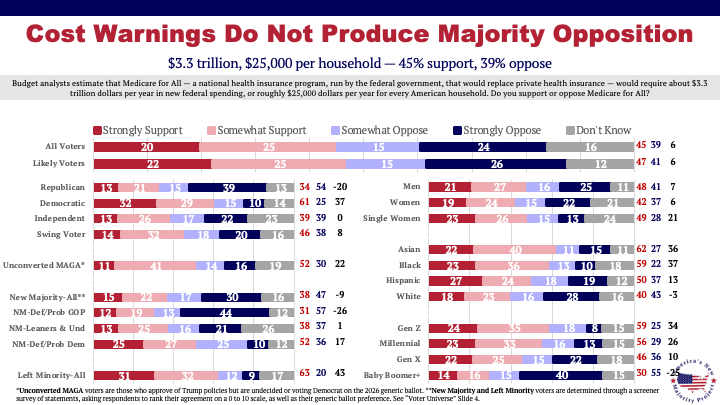
Cost doesn't bite. Told it runs $3.3 trillion a year $25,000 per household voters still back Medicare for All 45% to 39%.
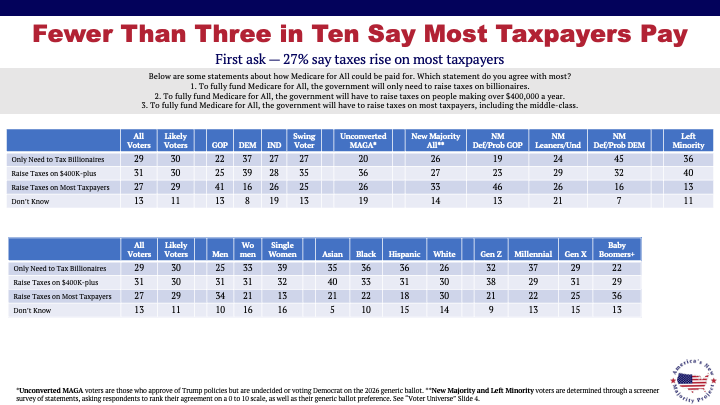
Voters don't expect the bill. Only 27% say most taxpayers would pay more, and 28% on a second ask.
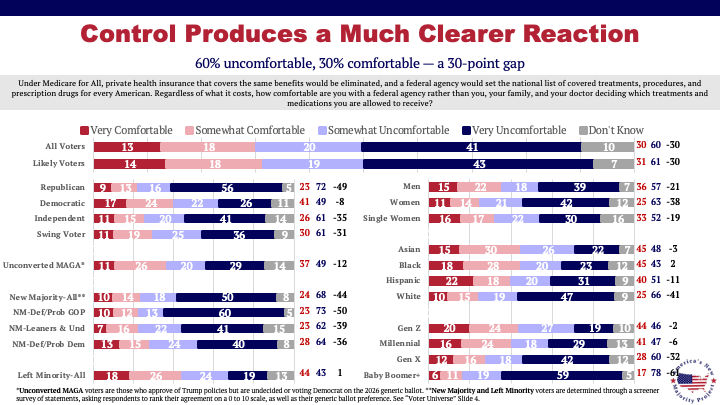
Control does bite. 60% are uncomfortable with a federal agency deciding their care vs. 30% comfortable — a 30-point gap that holds across party, including 49% of Democrats.
Lead with who decides, not what it costs. 61% already call government-run healthcare big government socialism, and 73% want a free-market system.
Why It Matters
Cost has long been central to the case against government-run healthcare. In this survey, a $3.3 trillion annual cost, roughly $25,000 per household, still leaves Medicare for All ahead by six points; a stronger tax-revenue comparison produces an almost even split.
By contrast, 60.3% are uncomfortable with a federal agency deciding covered treatments rather than patients, families, and doctors. The survey does not directly ask voters to rank cost versus control, but the contrast suggests personal decision-making is a more potent concern.
How To Use This Data
Lead with who decides, not what it costs. Neither cost test produces majority opposition. Federal control of treatment decisions leaves voters uncomfortable by 30 points, while fewer than three in ten say Medicare for All would require higher taxes on most taxpayers, including the middle class.
Cost Warnings Do Not Produce Majority Opposition
Told Medicare for All would cost roughly $3.3 trillion a year about $25,000 per household voters supportit 45% to 39%, a 6-point margin.
Republicans oppose 54% to 34%. Democrats support 61% to 25%. Independents split evenly, 39% support to 39% oppose.
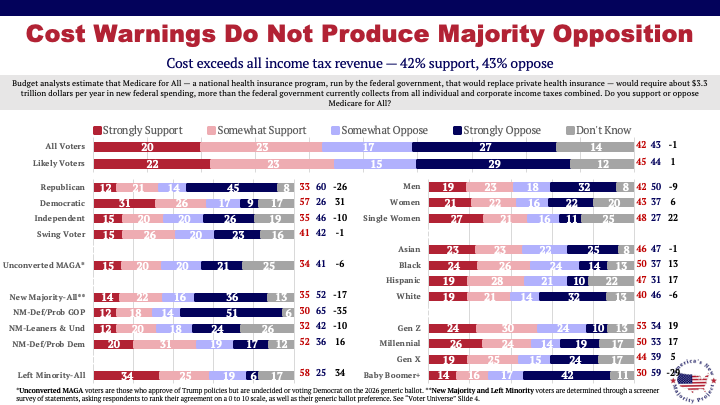
Told the annual cost exceeds everything the federal government collects from all individual and corporate income taxes combined, voters divide almost evenly: 42% support, 43% oppose.
Fewer Than Three in Ten Say Most Taxpayers Would Pay
Asked how Medicare for All would be funded, only 27% say it would require raising taxes on most taxpayers, including the middle class.
29% say only billionaires would need to be taxed. 31% say taxes would need to rise on people earning $400,000 or more.
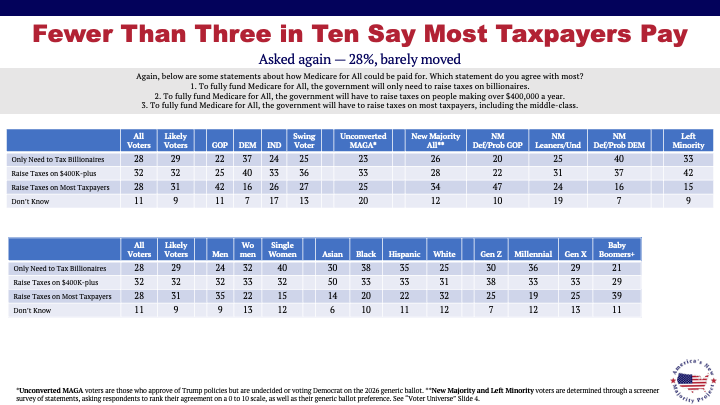
Asked again later in the survey, the figure barely moves — 28%. Republicans are at 42%; Democrats at 16%; independents at 26%.
Control Produces a Much Clearer Reaction
Asked how comfortable they are with a federal agency rather than themselves, their family, and their doctor deciding which treatments and medications they are allowed to receive, voters are uncomfortable 60% to 30% — a 30-point gap.
41% are very uncomfortable. For comparison, 24% strongly oppose Medicare for All in the $3.3 trillion/$25,000-per-household cost test.
The reaction crosses party lines. Republicans are uncomfortable 72% to 23%. Independents 61% to 26%. Among Democrats, 49% are uncomfortable and 41% comfortable.
Among women who backed the Republican ticket in 2024, discomfort reaches 80%.
Voters Already Have a Name for It
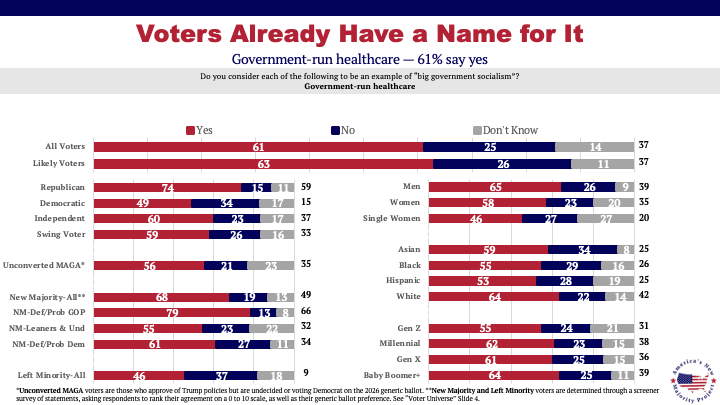
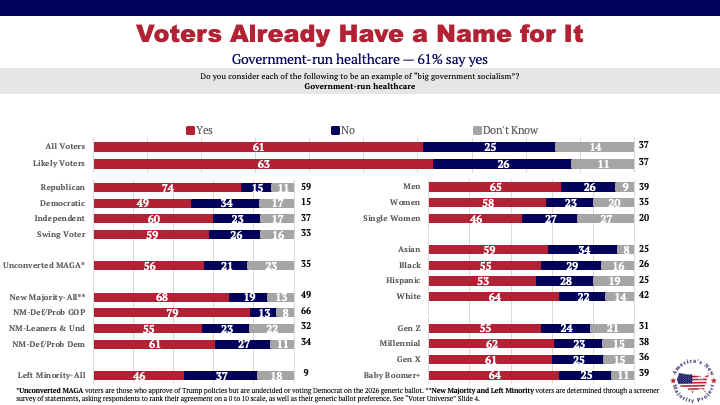
61.2% say government-run healthcare qualifies as big government socialism, including 60.2% of independents.
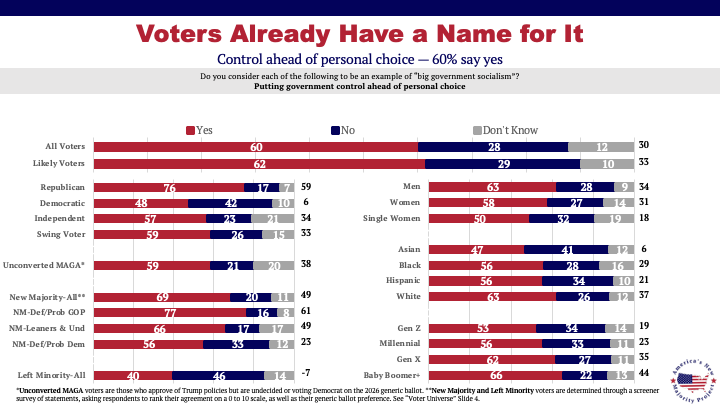
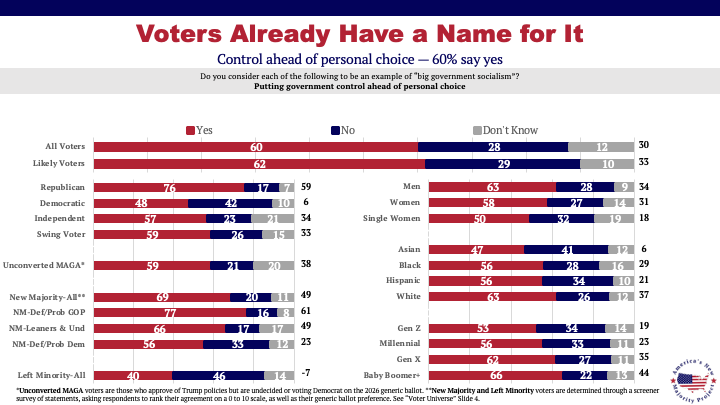
60.3% say putting government control ahead of personal choice qualifies as big government socialism, including 56.6% of independents.
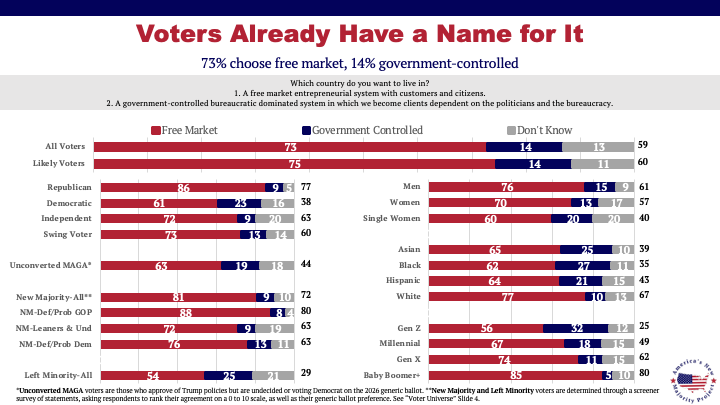
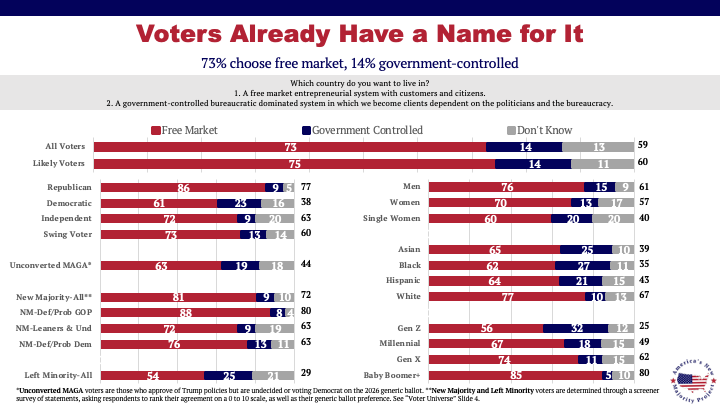
Asked to choose the kind of country they want to live in, 72.9% choose a free-market entrepreneurial system and 14.0% a government-controlled bureaucratic one. Among independents, it is 71.5% to 8.9%.
The Bottom Line
The survey does not directly ask voters to rank cost versus control. But the contrast is clear: the $3.3 trillion/$25,000 cost test leaves Medicare for All ahead 45.1% to 38.8%, and the stronger revenue comparison is nearly even, 42.4% to 43.3%. On federal control of treatment decisions, however, 60.3% are uncomfortable and 30.2% are comfortable. The evidence suggests personal control and choice resonate more clearly than fiscal scale alone.
America’s New Majority Project national survey of 2,000 registered voters, fielded August 29 – September 2, 2026. Margin of error ±2.2%. Items marked as split-sample carry ±3.1%.
What’s Next
Wewill share more analysis from our polling on Big Government Socialism and how voters feel heading into the Mid-Term elections.
Also, a new twice-a-week post from ANMP titled News and Numbers is released on Mondays and Thursdays. It takes mainstream news stories and matches them with ANMP survey data to show you several sides of how Americans see an issue. Don’t miss it!
We want to hear from you! We not only enjoy hearing from our subscribers, but we also use your feedback to bring you the most recent and engaging policy information available. Share how you’re using this data or tell us what new insights you’d like to see.
Get in touch with us anytime, and let’s make an impact together!
Devil always in the details, and we know the government “plans” go to hell in a hand basket of “more money needed” demands.
Start a pilot program, Medicare for All Congressman. No private care allowed.